

@7/29/2022
개요
정사영상(위)을 고도로 색상화(아래)하는 방법
INPUT
•
정사영상.tif
•
DEM.tif ( 픽셀에 고도값 들어있음 )
Topic
1.
z값을 RGB 색상으로 표현하는 방법
2.
최소한의 메모리만 사용하여 처리하는 방법
3.
최소한의 시간만 사용하여 처리하는 방법
Issue
메모리 사용량은 처리시간과 반비례하다.
메모리 사용량은 처리 시간과 트레이트오프 관계이다.
단일 픽셀을 고도로 색상화 하는 방법
1.
컬러맵 RGB 색상 스팩트럼을 준비합니다. 스팩트럼을 256 단계로 쪼개서 array로 만듭니다.

2.
DEM.tif 에서 모든 고도값을 뽑아옵니다. 고도값의 분포를 1~256 사이로 Normalization 합니다.
3.
Normalization된 고도값으로 컬러맵 array를 인덱싱하면 고도에 해당하는 RGB색상을 구할 수 있습니다.
메모리 한계치를 초과하는 대규모 정사영상 처리 방법
•
수 km 범위의 지역을 촬영한 고품질 정사영상은 픽셀 갯수가 기본 억단위에서 10억 단위입니다.
•
모든 픽셀을 Array로 변환하는게 필수적인데 픽셀 갯수가 많으면 Array를 생성하는 모든 과정에서 메모리 에러가 발생할 수 있습니다.
1.
메모리가 감당 가능한 이미지 크기를 정의합니다. 설명을 위해 100px이라고 하겠습니다.
2.
정사영상을 100px근사치로 균일하게 쪼갤 그리드를 정의합니다.
3.
정의된 그리드 한칸씩 이미지를 잘라서 가져온 뒤 처리합니다.
4.
처리된 이미지 조각들을 다시 하나로 합칩니다.
5.
저장할때도 메모리 이슈가 발생하므로 lzw 압축 옵션으로 저장합니다.
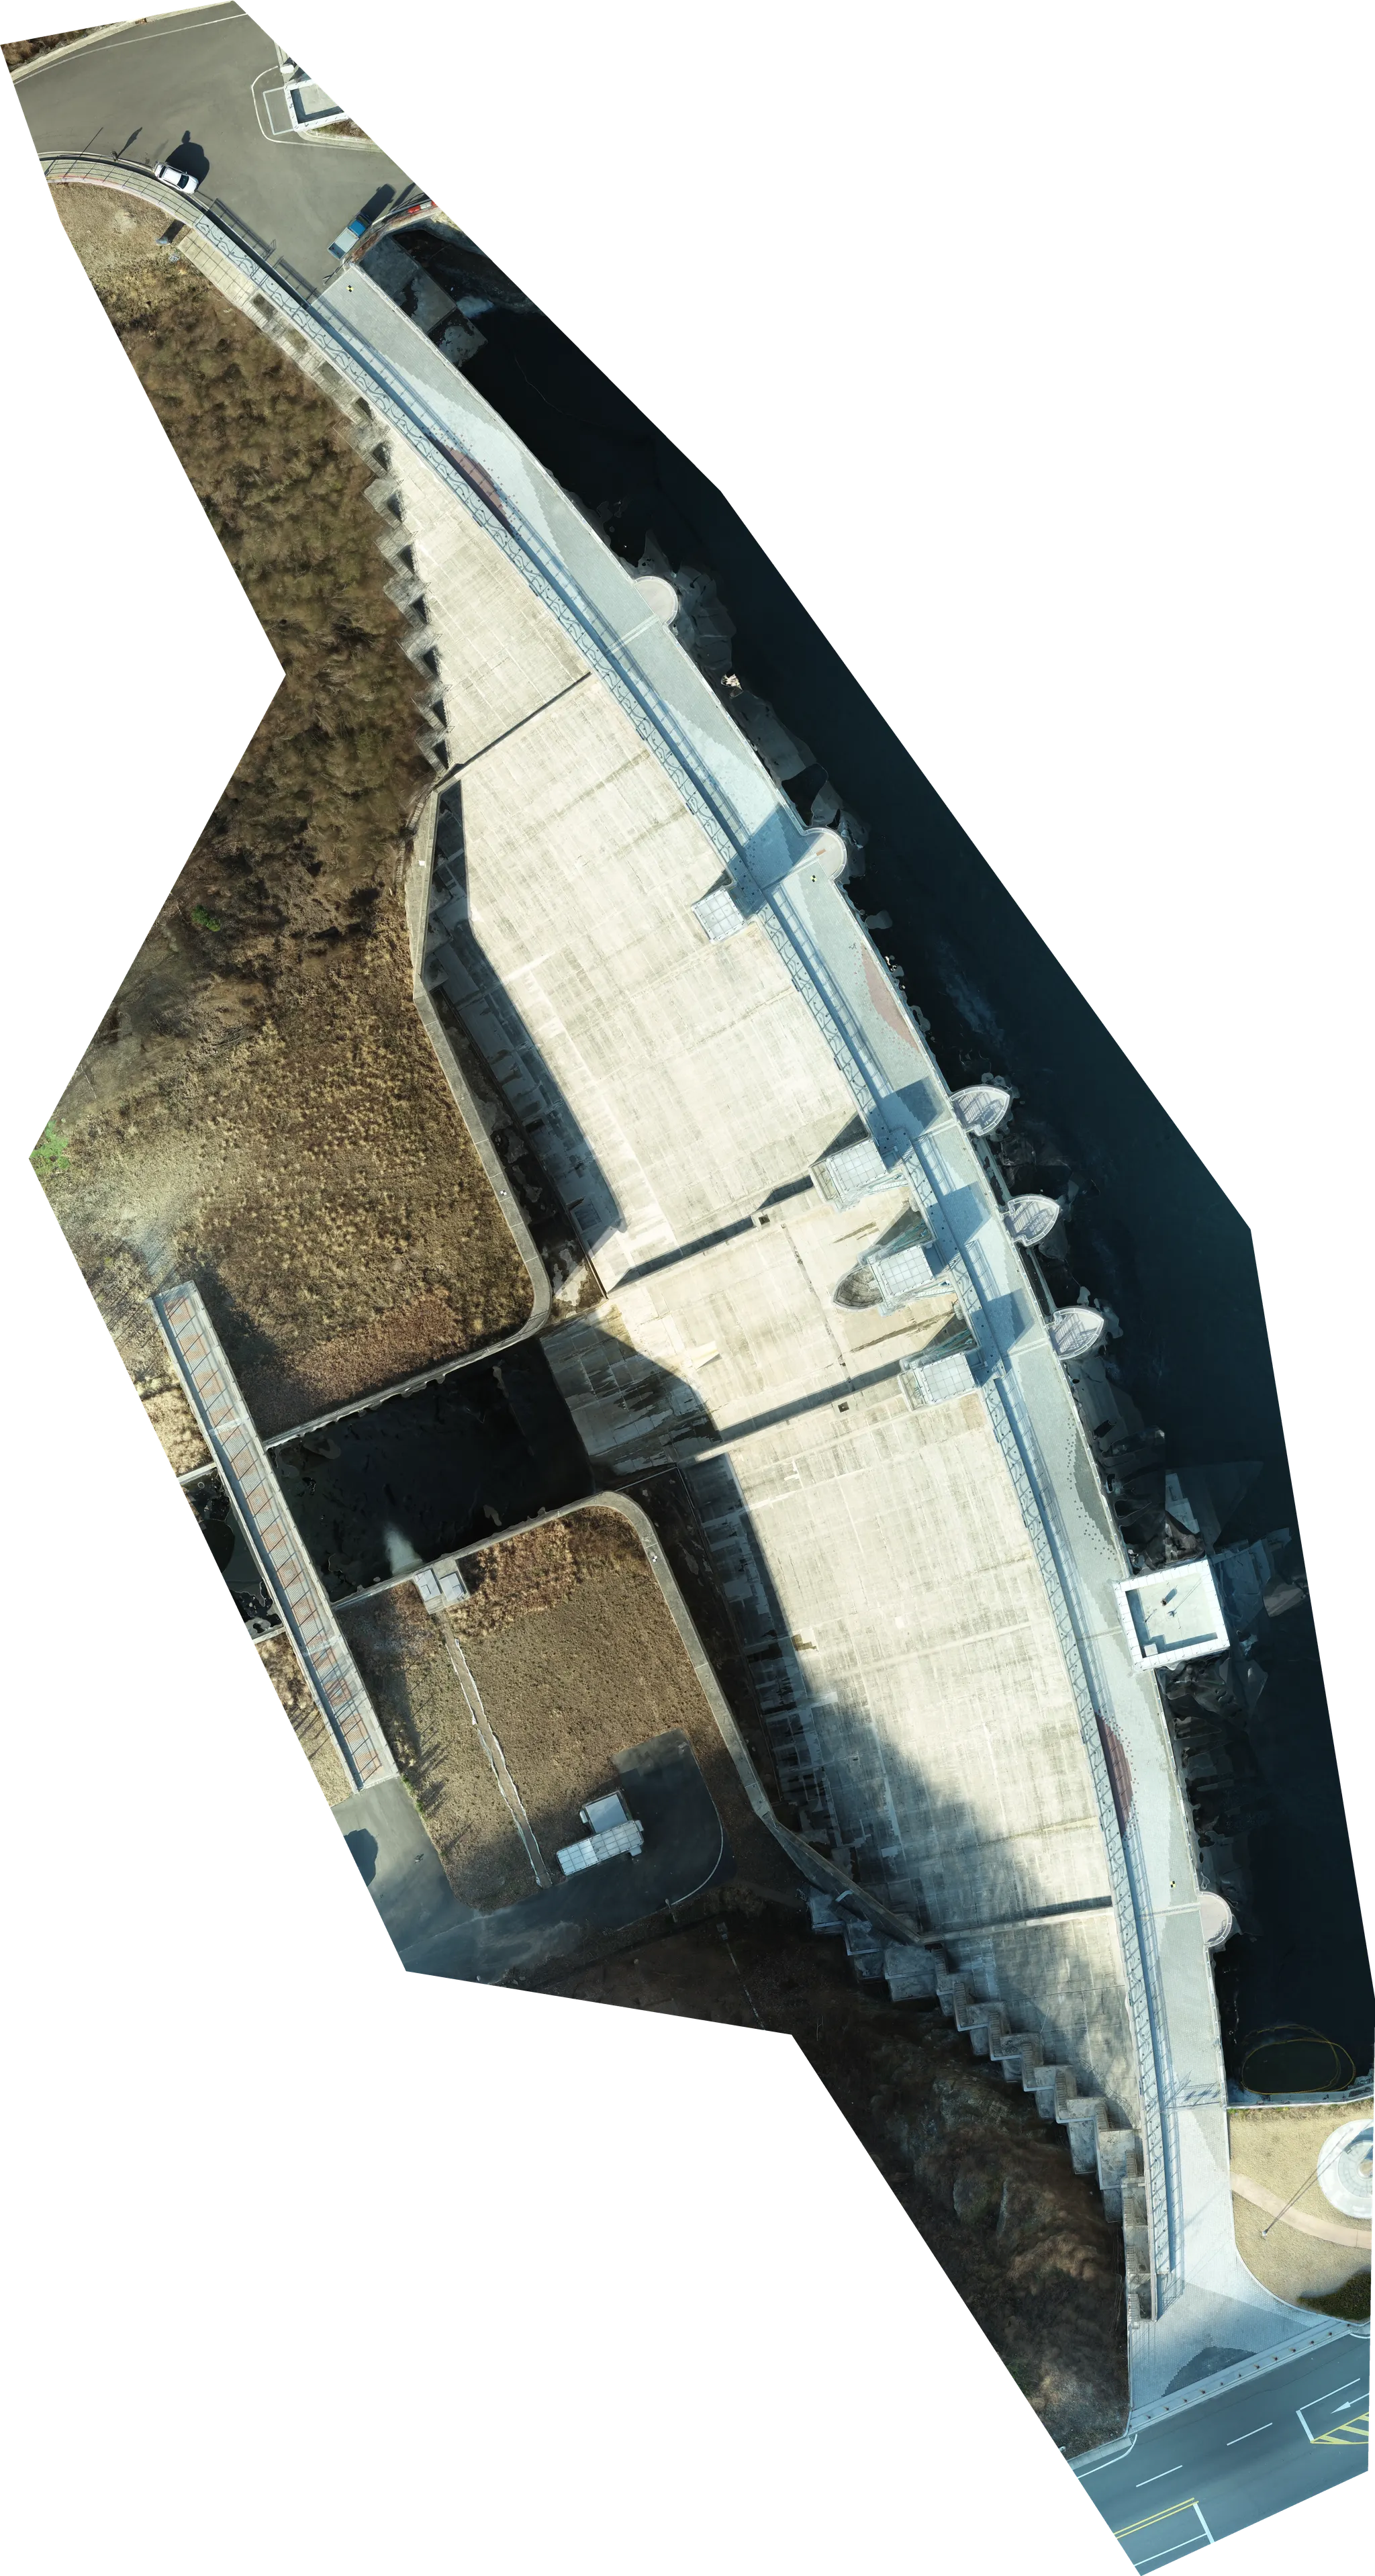
정사영상
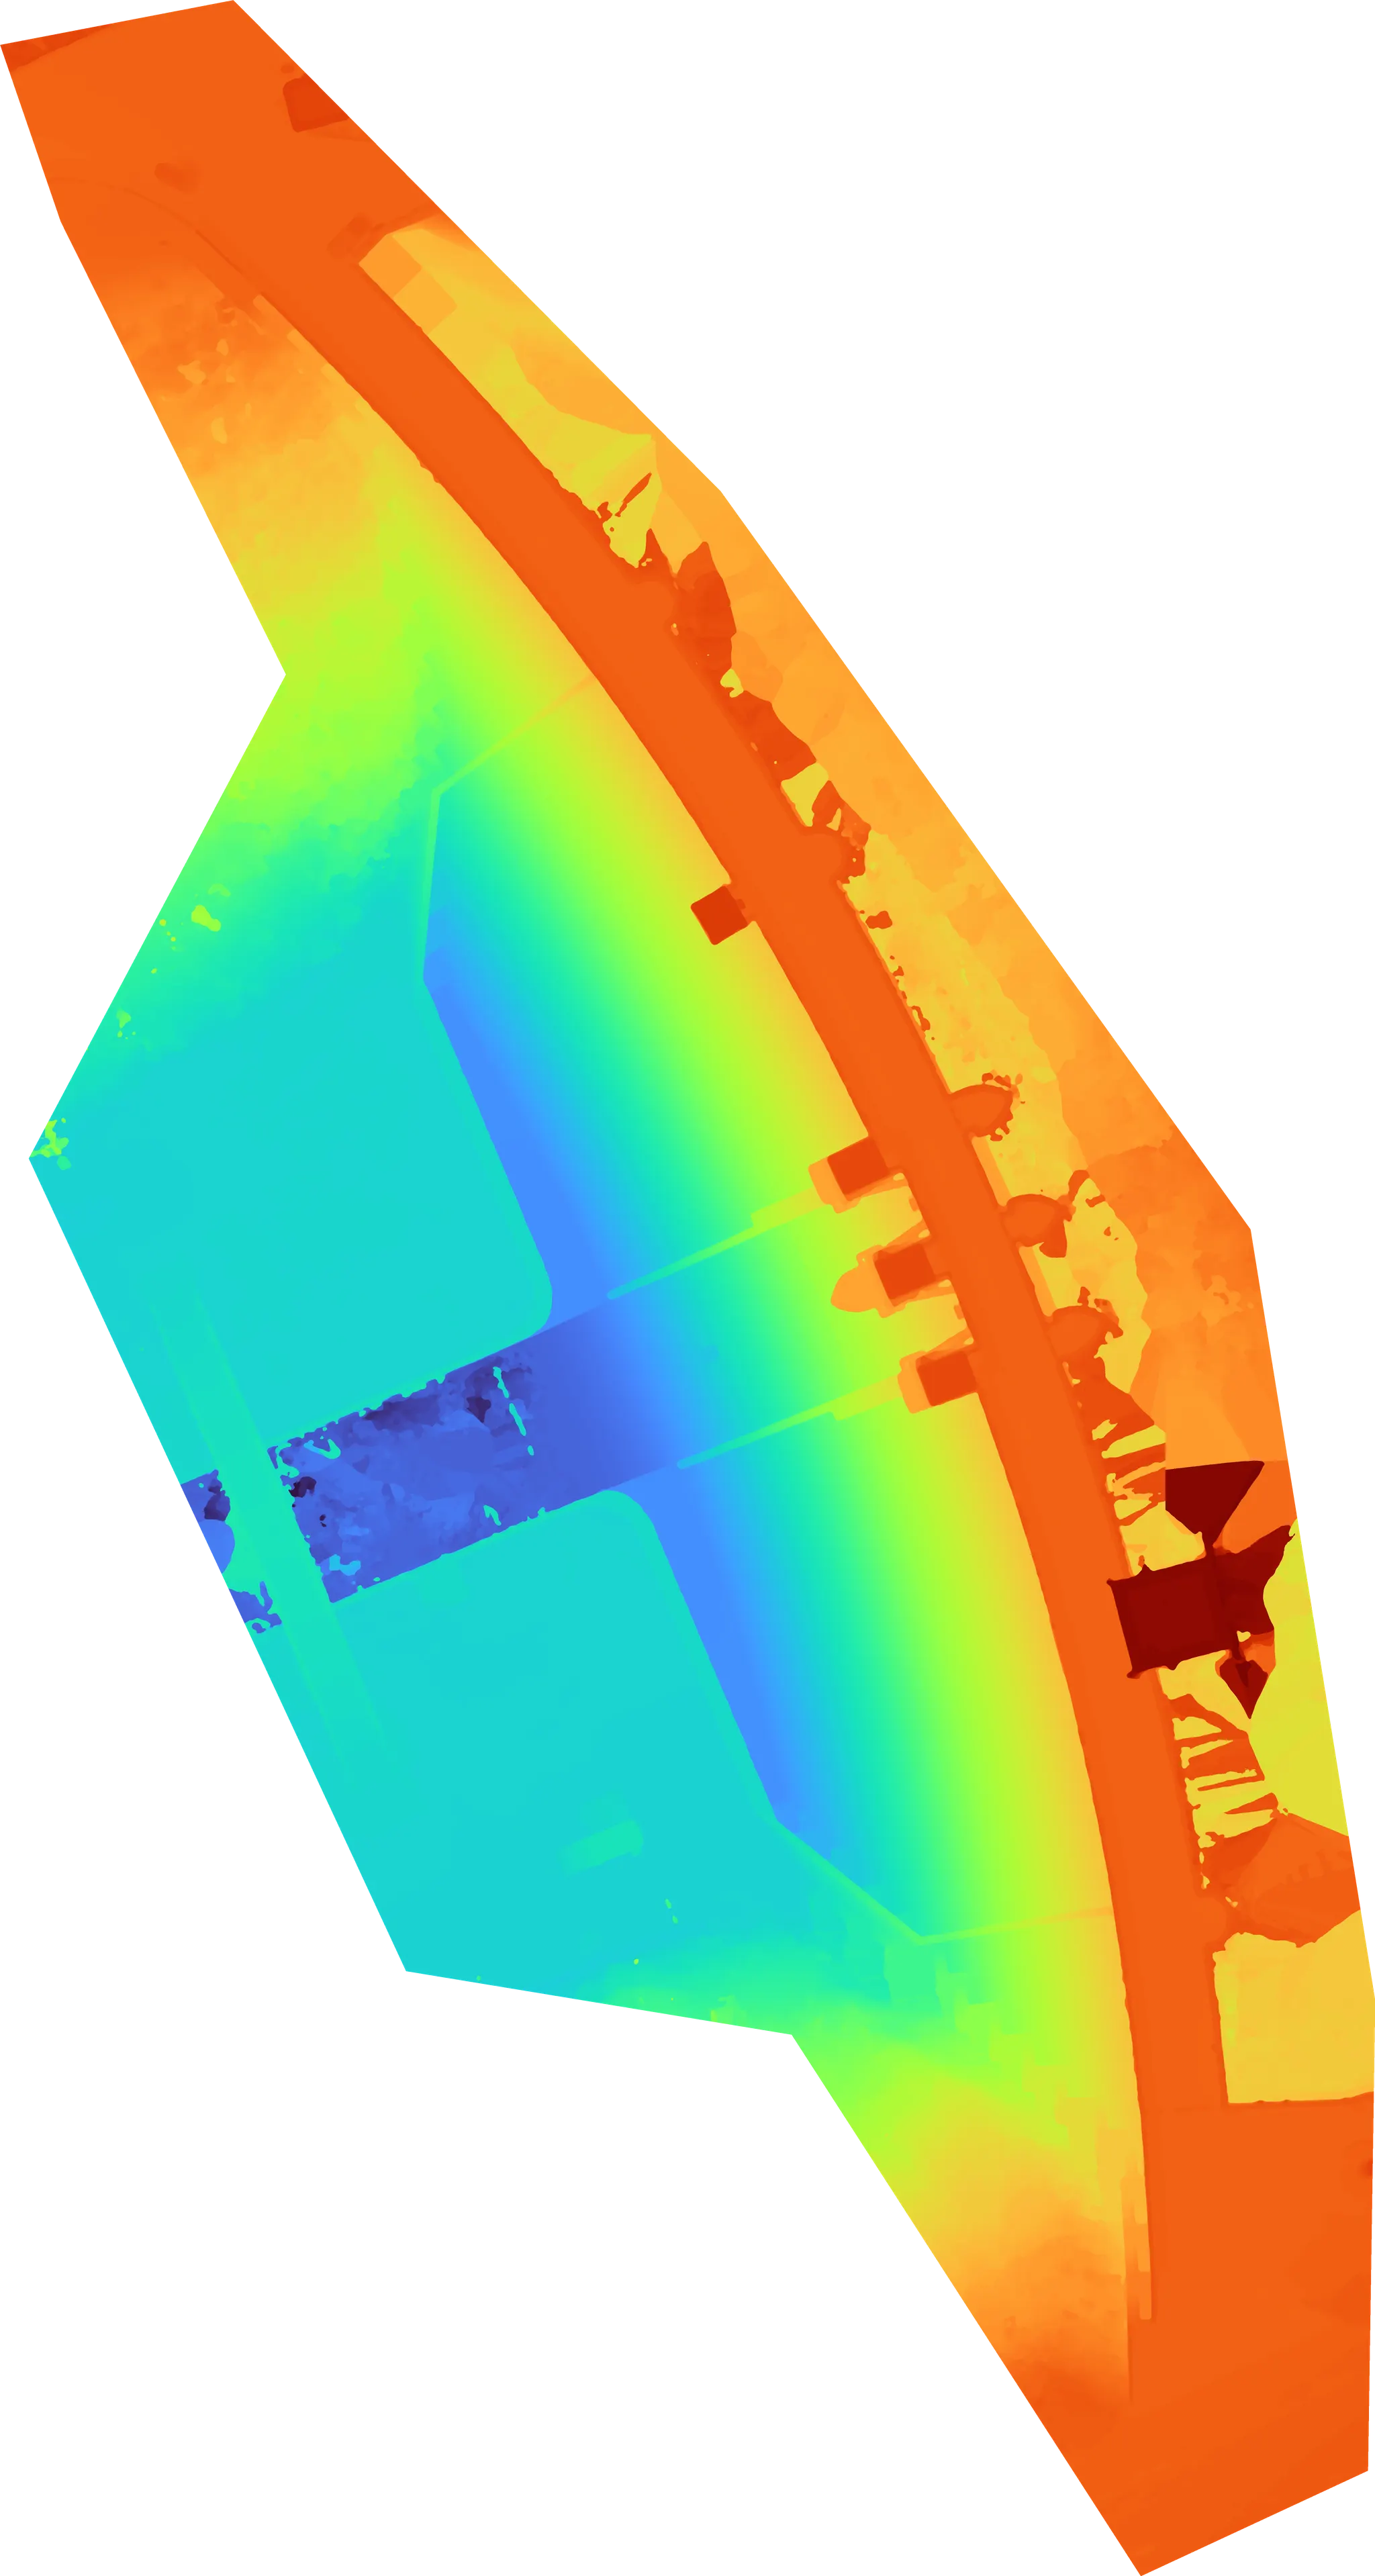
고도로 색상화
소스코드
from __future__ import annotations
import io
import math
from typing import Callable, Iterable, List
import rioxarray
import numpy as np
from numpy.typing import NDArray
from PIL import Image
from PIL.Image import Image as PilImage
def get_missing_value(dem: bytes) -> float:
raster = rioxarray.open_rasterio(io.BytesIO(dem), cache=False)
return raster.rio.nodata
class Unit:
"""이미지 분할을 위한 Graph 자료구조 구현"""
def __init__(
self, width: int, height: int, left_unit: Unit = None, top_unit: Unit = None
):
self.left_unit = left_unit
self.top_unit = top_unit
self.width = width
self.height = height
self.right = self.get_right()
self.bottom = self.get_bottom()
self.left = self.right - self.width
self.top = self.bottom - self.height
def get_right(self) -> int:
"""그리드 왼쪽과 유닛의 오른족 사이의 거리를 구합니다."""
def _func(unit):
return _func(unit.left_unit) + unit.width if unit.left_unit else unit.width
return _func(self)
def get_bottom(self) -> int:
"""그리드 상단과 유닛 하단 사이의 거리를 구합니다."""
def _func(unit):
return _func(unit.top_unit) + unit.height if unit.top_unit else unit.height
return _func(self)
class Grid:
"""이미지를 메모리 안전하게 그리드로 분할하여 처리해주는 클래스"""
def __init__(self, img: PilImage, buffer_size: int = 200_000_000):
"""
- 이미지를 메모리 안전한 크기로 분할 처리 해줍니다.
- buffer_size : 메모리 안전한 pixel 갯수
"""
self.img = img
self.width, self.height = img.size
self.min_unit_segment = round(math.sqrt(buffer_size / 4))
def split_segment(self, segment: int) -> List[int]:
"""
- segment: 한 변의 길이
- 알고리즘
1. 최소 길이로 쪼개고 남는 길이를 다시 분배해서 더합니다.
2. 더해진 결과는 무조건 최대 길이보다 작습니다.
- 최대 길이는 buffer_size 크기인 정사각형 한 변의 길이입니다.
"""
unit_cnt = segment // self.min_unit_segment # 유닛 갯수
remainder = segment % self.min_unit_segment # 남는 길이
complement = remainder // unit_cnt # 남는 길이를 고르게 분배
last_complement = complement + remainder % unit_cnt # 고르게 분배한 뒤, 남는 길이
even = [self.min_unit_segment + complement] # 한 변의 길이
edge = [self.min_unit_segment + last_complement] # 외곽 변 길이
split_plan = even * (unit_cnt - 1) + edge
return split_plan
def split_area(self, width: int, height: int):
"""
- 큰 직사각형을 buffer_size보다 작은 직사각형으로 쪼개는 방법을 알려줍니다.
- 최대한 균등하게 쪼개줍니다.
- width, height : 쪼갤 직사각형의 너비와 높이
"""
width_split: list = self.split_segment(width)
height_split: list = self.split_segment(height)
# 버퍼 사이즈보다 작으면 쪼갤 필요 없다.
if self.min_unit_segment >= width:
width_split: list = [width]
if self.min_unit_segment >= height:
height_split: list = [height]
return width_split, height_split
def generate_units(self) -> Iterable[Unit]:
"""
- 이미지를 어떻게 쪼개야 하는지 알려주는 Unit객체를 이터레이션합니다.
- 이터레이션하면서 Graph 구조를 만듭니다.
"""
width_split, height_split = self.split_area(self.width, self.height)
top_unit = None
for height in height_split:
left_unit = None
for width in width_split:
yield (
unit := Unit(
width,
height,
left_unit=left_unit,
top_unit=top_unit,
)
)
left_unit = unit
top_unit = unit
def map(self, func: Callable[[PilImage], any]):
"""
- 이미지 처리 함수를 받아서 메모리 안전하게 분할처리 해줍니다.
- 처리 결과를 반환하지 않습니다.
"""
for unit in self.generate_units():
box = (unit.left, unit.top, unit.right, unit.bottom)
fregment = self.img.crop(box)
func(fregment)
def map_reduce(self, func: Callable[[PilImage], PilImage]) -> PilImage:
"""
- 이미지 처리 함수를 받아서 메모리 안전하게 분할처리 해줍니다.
- 처리 결과를 반환합니다.
"""
template_img = Image.new("RGBA", self.img.size, (0, 0, 0, 0))
for unit in self.generate_units():
box = (unit.left, unit.top, unit.right, unit.bottom)
fregment = self.img.crop(box)
template_img.paste(func(fregment), (unit.left, unit.top))
return template_img
class Surface2Color:
"""DEM(digital elevation model) 고도 색상화"""
def __init__(self, *, colormap: list, missing_value: float):
"""
- DEM 이미지를 컬러맵 색상으로 표현해줍니다.
- missing_value: DEM모델에서 결측치를 의미하는 실수 값
- missing_value는 크거나 작거나 실제 값 범위에서 벗어나야만 합니다.
"""
self.colormap = colormap
self.missing_value = missing_value
self.missing_pixel = [0, 0, 0, 0] # 결측치 색상표현은 투명색으로
self.min_z, self.max_z = math.inf, -math.inf
def normalization(self, z: float | NDArray) -> int | NDArray:
"""
- z값을 colormap 범위로 normalization 합니다.
- 인덱스로 사용할 수 있도록 정수로 반올림해서 반환합니다.
"""
y = (z - self.min_z) * (len(self.colormap) - 1) / (self.max_z - self.min_z)
return np.round(y)
def fit(self, dem_img: PilImage):
"""
- 데이터를 학습하여 normalization 함수를 업데이트합니다.
- fit은 여러번 실행시킬 수 있습니다. 각 이터레이션마다 accumulation됩니다.
- 이미지 A,B,C를 하나로 합친 이미지 X가 있을 때 fit(X) = fit(A) -> fit(B) -> fit(C) (순서무관)
"""
matrix = np.array(dem_img)
unique_array = np.unique(matrix.flatten())
correct_array = unique_array[unique_array != self.missing_value]
if not correct_array: # 모든 값이 결측치인 경우에는 학습할 고도 없음, 무시
return
if self.min_z > (min_z := correct_array.min()): # min_z 업데이트
self.min_z = min_z
if self.max_z < (max_z := correct_array.max()): # max_z 업데이트
self.max_z = max_z
def transform(self, dem_img: PilImage) -> PilImage:
"""Z matrix -> RGBA matrix"""
matrix = np.array(dem_img)
# 결측치가 normalization되었을 때 어떤 값인지 알아야 normalization이후 결측치를 걸러낼 수 있음
missing_value_idx = int(self.normalization(self.missing_value))
idx_matrix = self.normalization(matrix).astype(int)
def pixel_generator():
for idx in idx_matrix.flatten():
if idx == missing_value_idx:
yield from self.missing_pixel
else:
yield from self.colormap[idx]
length = idx_matrix.size * 4 # idx_matrix.flatten() 길이
pixel_array = np.fromiter(pixel_generator(), count=length, dtype=np.uint8)
pixel_matrix = pixel_array.reshape(matrix.shape + (4,))
return Image.fromarray(pixel_matrix)
# ======== 실행함수 ========
def dem_colorize_tiling(dem:bytes, ortho:bytes) -> bytes:
"""DEM을 색상화하고 타일화 한 뒤 S3에 업로드"""
dem_img = Image.open(io.BytesIO(dem))
ortho_img = Image.open(io.BytesIO(ortho))
model = Surface2Color(
colormap=turbo,
missing_value=get_missing_value(GeotiffData.dem),
)
grid = Grid(dem_img)
grid.map(model.fit)
colorized_dem_pil = grid.map_reduce(model.transform)
colorized_dem_pil.save(
buffer := io.BytesIO(),
"tiff",
save_all=True,
tiffinfo=ortho_img.tag_v2,
compression="tiff_lzw",
)
colorized_dem = buffer.getvalue()
return colorized_dem
Python
복사
colormap.py
fromiter 쓰는 이유
데이터가 100만개를 넘어가면 np.fromtiter가 np.array(list(...)) 보다 10배 이상 빠름, 이터레이션 자체가 빨라진다고 볼 수 있음
import time
import random
import numpy as np
a = {"value": 0}
def gen():
for _ in range(1_000_000):
v = random.randint(-9999, 9999) ** 4
yield v
a["value"] = v
start = time.time()
np.array(list(gen()))
end = time.time()
print(end - start, "<- np.array(list(...)")
start = time.time()
np.fromiter(gen(), dtype=float, count=100_000)
end = time.time()
print(end - start, "<- np.fromtiter")
print(a)
Python
복사
밴치마크 테스트용 코드